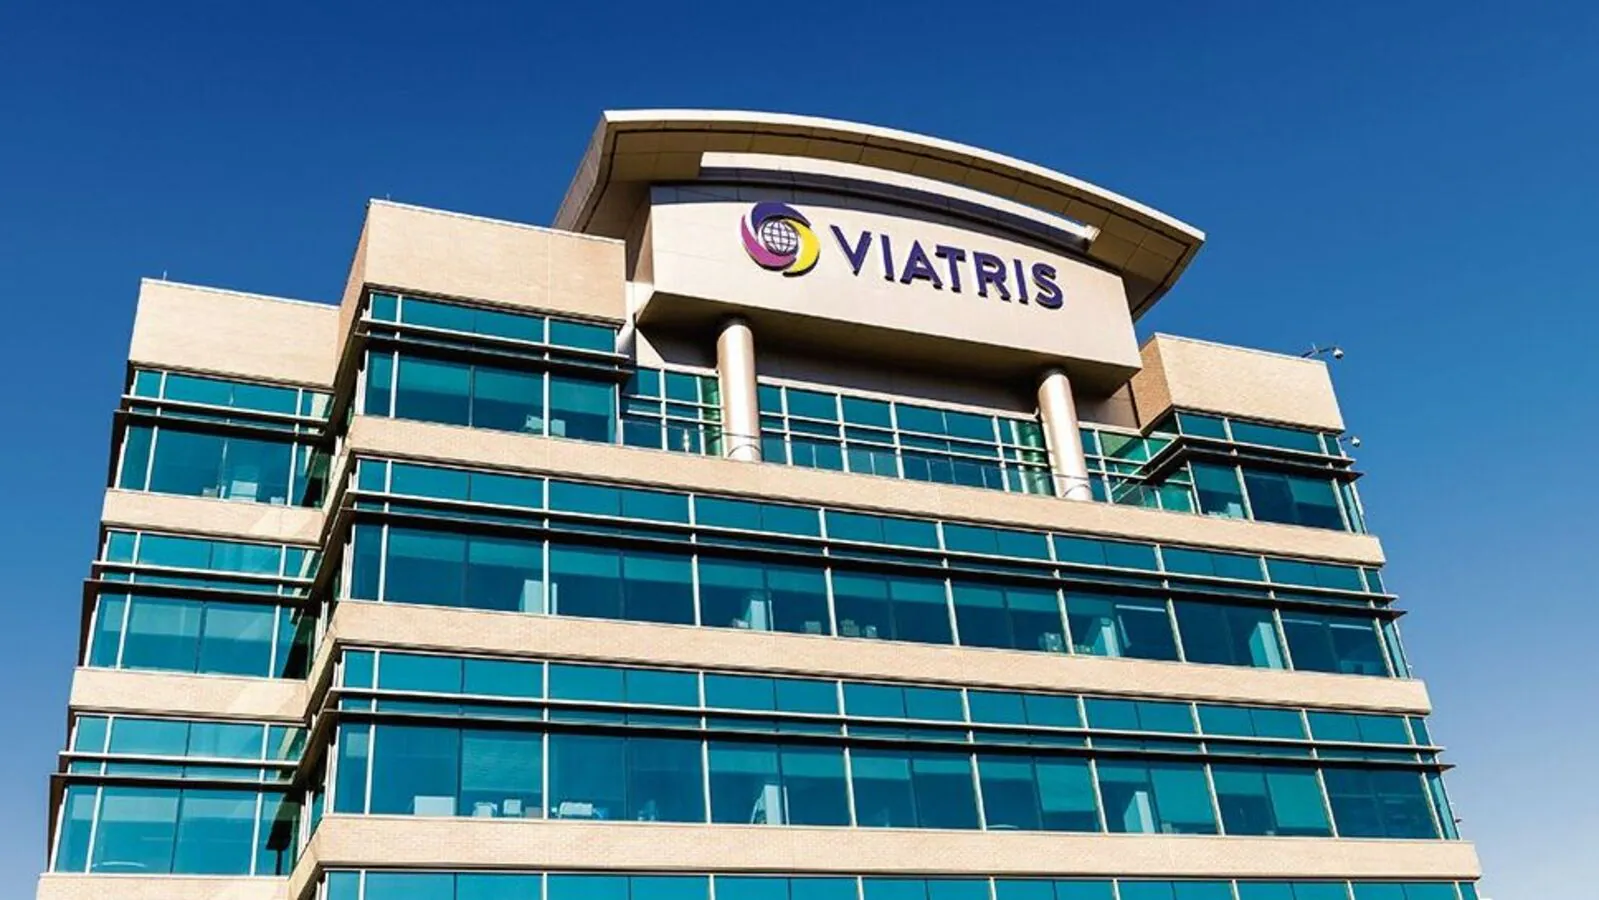
Is Viatris Inc. (VTRS) a Smart Investment? Explore key growth drivers, risks, and valuation insights in our in-depth analysis. Read now!
Featured Company Profile
VTRS
Viatris Inc.
$8.87
10.41 Billion
N/A
N/A
Drug Manufacturers - Specialty & Generic
Healthcare
Stock Research Report: Viatris Inc. (VTRS) – Q4 2024
Summary
Viatris Inc. (NASDAQ: VTRS) is a global pharmaceutical company focusing on generics, biosimilars, and novel therapies. The company reported FY 2024 revenue of $14.7 billion, marking a 2% YoY decline. Management executed key divestitures, reduced gross leverage, and prioritized shareholder returns through $825 million in dividends and share repurchases. However, regulatory challenges at its Indore, India facility significantly impacted financial guidance for 2025.
Investment Potential
Short-Term (2025-2026)
🛑 Risks & Challenges:
- Regulatory & Operational Risks: FDA import alert and warning letter for Indore, India, affecting 11 key products, including Revlimid (Lenalidomide).
- Financial Weakness: Revenue decline projected at 1% in 2025, with $500 million revenue impact from Indore issues and an EBITDA reduction of $385 million.
- Debt Management: High total debt of $15.98 billion (down from $18.37 billion in 2023), but continued financial strain.
- Industry Competition: Generic price erosion and increasing competition in complex generics.
✅ Growth Drivers:
- New Product Launches: Targeting $450M-$550M in new product revenues with key complex generics (Iron Sucrose, Octreotide, Liraglutide, and Glucagon).
- Shareholder Returns: At least $500M-$650M in share buybacks and $574M in dividends, supporting the stock.
- Pipeline Expansion: 10 molecules in Phase 3 trials, including Effexor (Generalized Anxiety Disorder, Japan) and Meloxicam (Opioid-sparing pain treatment).
- Cost Reduction Plan: Enterprise-wide review to streamline operations, expected to deliver cost savings in 2026.
⚠️ Verdict: Speculative Buy – The stock has near-term risks due to regulatory hurdles, but strong shareholder returns and potential long-term pipeline success could offer upside.
Long-Term (2027 & Beyond)
✅ Long-Term Growth Drivers:
- Pipeline Expansion: Strong late-stage development in ophthalmology, cardiovascular, and chronic disease therapies.
- Financial Recovery: Debt reduction, streamlined operations, and ramp-up of complex generics and branded drugs.
- Geographic Growth: Expanding presence in China, India, and Latin America, leveraging an aging population and chronic disease demand.
- Potential M&A Activity: Regional acquisitions and partnerships to strengthen revenue streams.
🛑 Long-Term Risks:
- Regulatory Scrutiny: Compliance concerns may impact operations and limit market access.
- Competitive Pressures: Large players (e.g., Teva, Catalent, Takeda) dominate the generics and biosimilars space.
- Patent Cliff Concerns: Several key products may face increased generic competition.
✅ Verdict: Moderate Buy / Watchlist – Long-term potential remains attractive, but regulatory and operational execution are key risks.
Business Quality
🔹 Moderate Risk – Strong revenue streams, but regulatory overhang and generic price pressure limit stability.
Financial Highlights (FY 2024 vs. FY 2023)
| Metric | 2024 | 2023 | YoY Change |
|---|---|---|---|
| Revenue | $14.7B | $15.4B | -2% |
| Gross Margin | 38.2% | 41.7% | -3.5% |
| EBITDA | $10M | $3.46B | -99.7% |
| Net Income | -634M | $54M | N/A |
| Free Cash Flow | $1.98B | $2.32B | -14.7% |
| Debt (Total) | $15.98B | $18.37B | -13% |
Future Estimates (2025-2028)
| Year | Revenue (Avg) | EBITDA (Avg) | Net Income (Avg) | EPS (Avg) |
|---|---|---|---|---|
| 2025 | $13.93B | $2.89B | $2.85B | $2.37 |
| 2026 | $14.09B | $2.92B | $3.02B | $2.49 |
| 2027 | $14.02B | $2.91B | $648M | $2.59 |
| 2028 | $19.88B | $4.12B | $2.89B | $2.42 |
Peer Comparison & Valuation
| Company | P/E Ratio | P/FCF | Debt/Equity | 2025 Revenue Forecast |
|---|---|---|---|---|
| Viatris (VTRS) | -17.68 | 8.0 | 0.86 | $13.9B (-1%) |
| Teva (TEVA) | 20.1 | 12.5 | 1.4 | $15.2B (+3%) |
| Catalent (CTLT) | 21.6 | 14.3 | 0.92 | $4.2B (-4%) |
| Takeda (TAK) | 16.4 | 11.2 | 1.2 | $31.5B (+2%) |
Intrinsic Valuation (DCF Model)
- Projected Revenue CAGR (2025-2028): 1.5%-2.0%
- Discount Rate (WACC): 9%
- Intrinsic Value Per Share: $9.50 - $12.00
- Current Share Price: $9.37 (Fairly valued, slightly undervalued based on DCF)
Final Investment Assessment
📌 Short-Term (2025-2026): ⚠️ Speculative Buy (Regulatory risk but improving financials)
📌 Long-Term (2027+): ✅ Moderate Buy (Pipeline expansion, cost reductions, strategic growth opportunities)
Disclaimer
"This analysis is for informational purposes only and not financial advice. Conduct independent research before investing."
Disclaimer:
The information provided in this article is for educational purposes only and should not be construed as investment advice. estima...
Author
Shaik K is an expert in financial markets, a seasoned trader, and investor with over two decades of experience. As the CEO of a leading fintech company, he has a proven track record in financial products research and developing technology-driven solutions. His extensive knowledge of market dynamics and innovative strategies positions him at the forefront of the fintech industry, driving growth and innovation in financial services.


